Hipcamp Engineering: Using the Sun and Moon to Predict Conversion

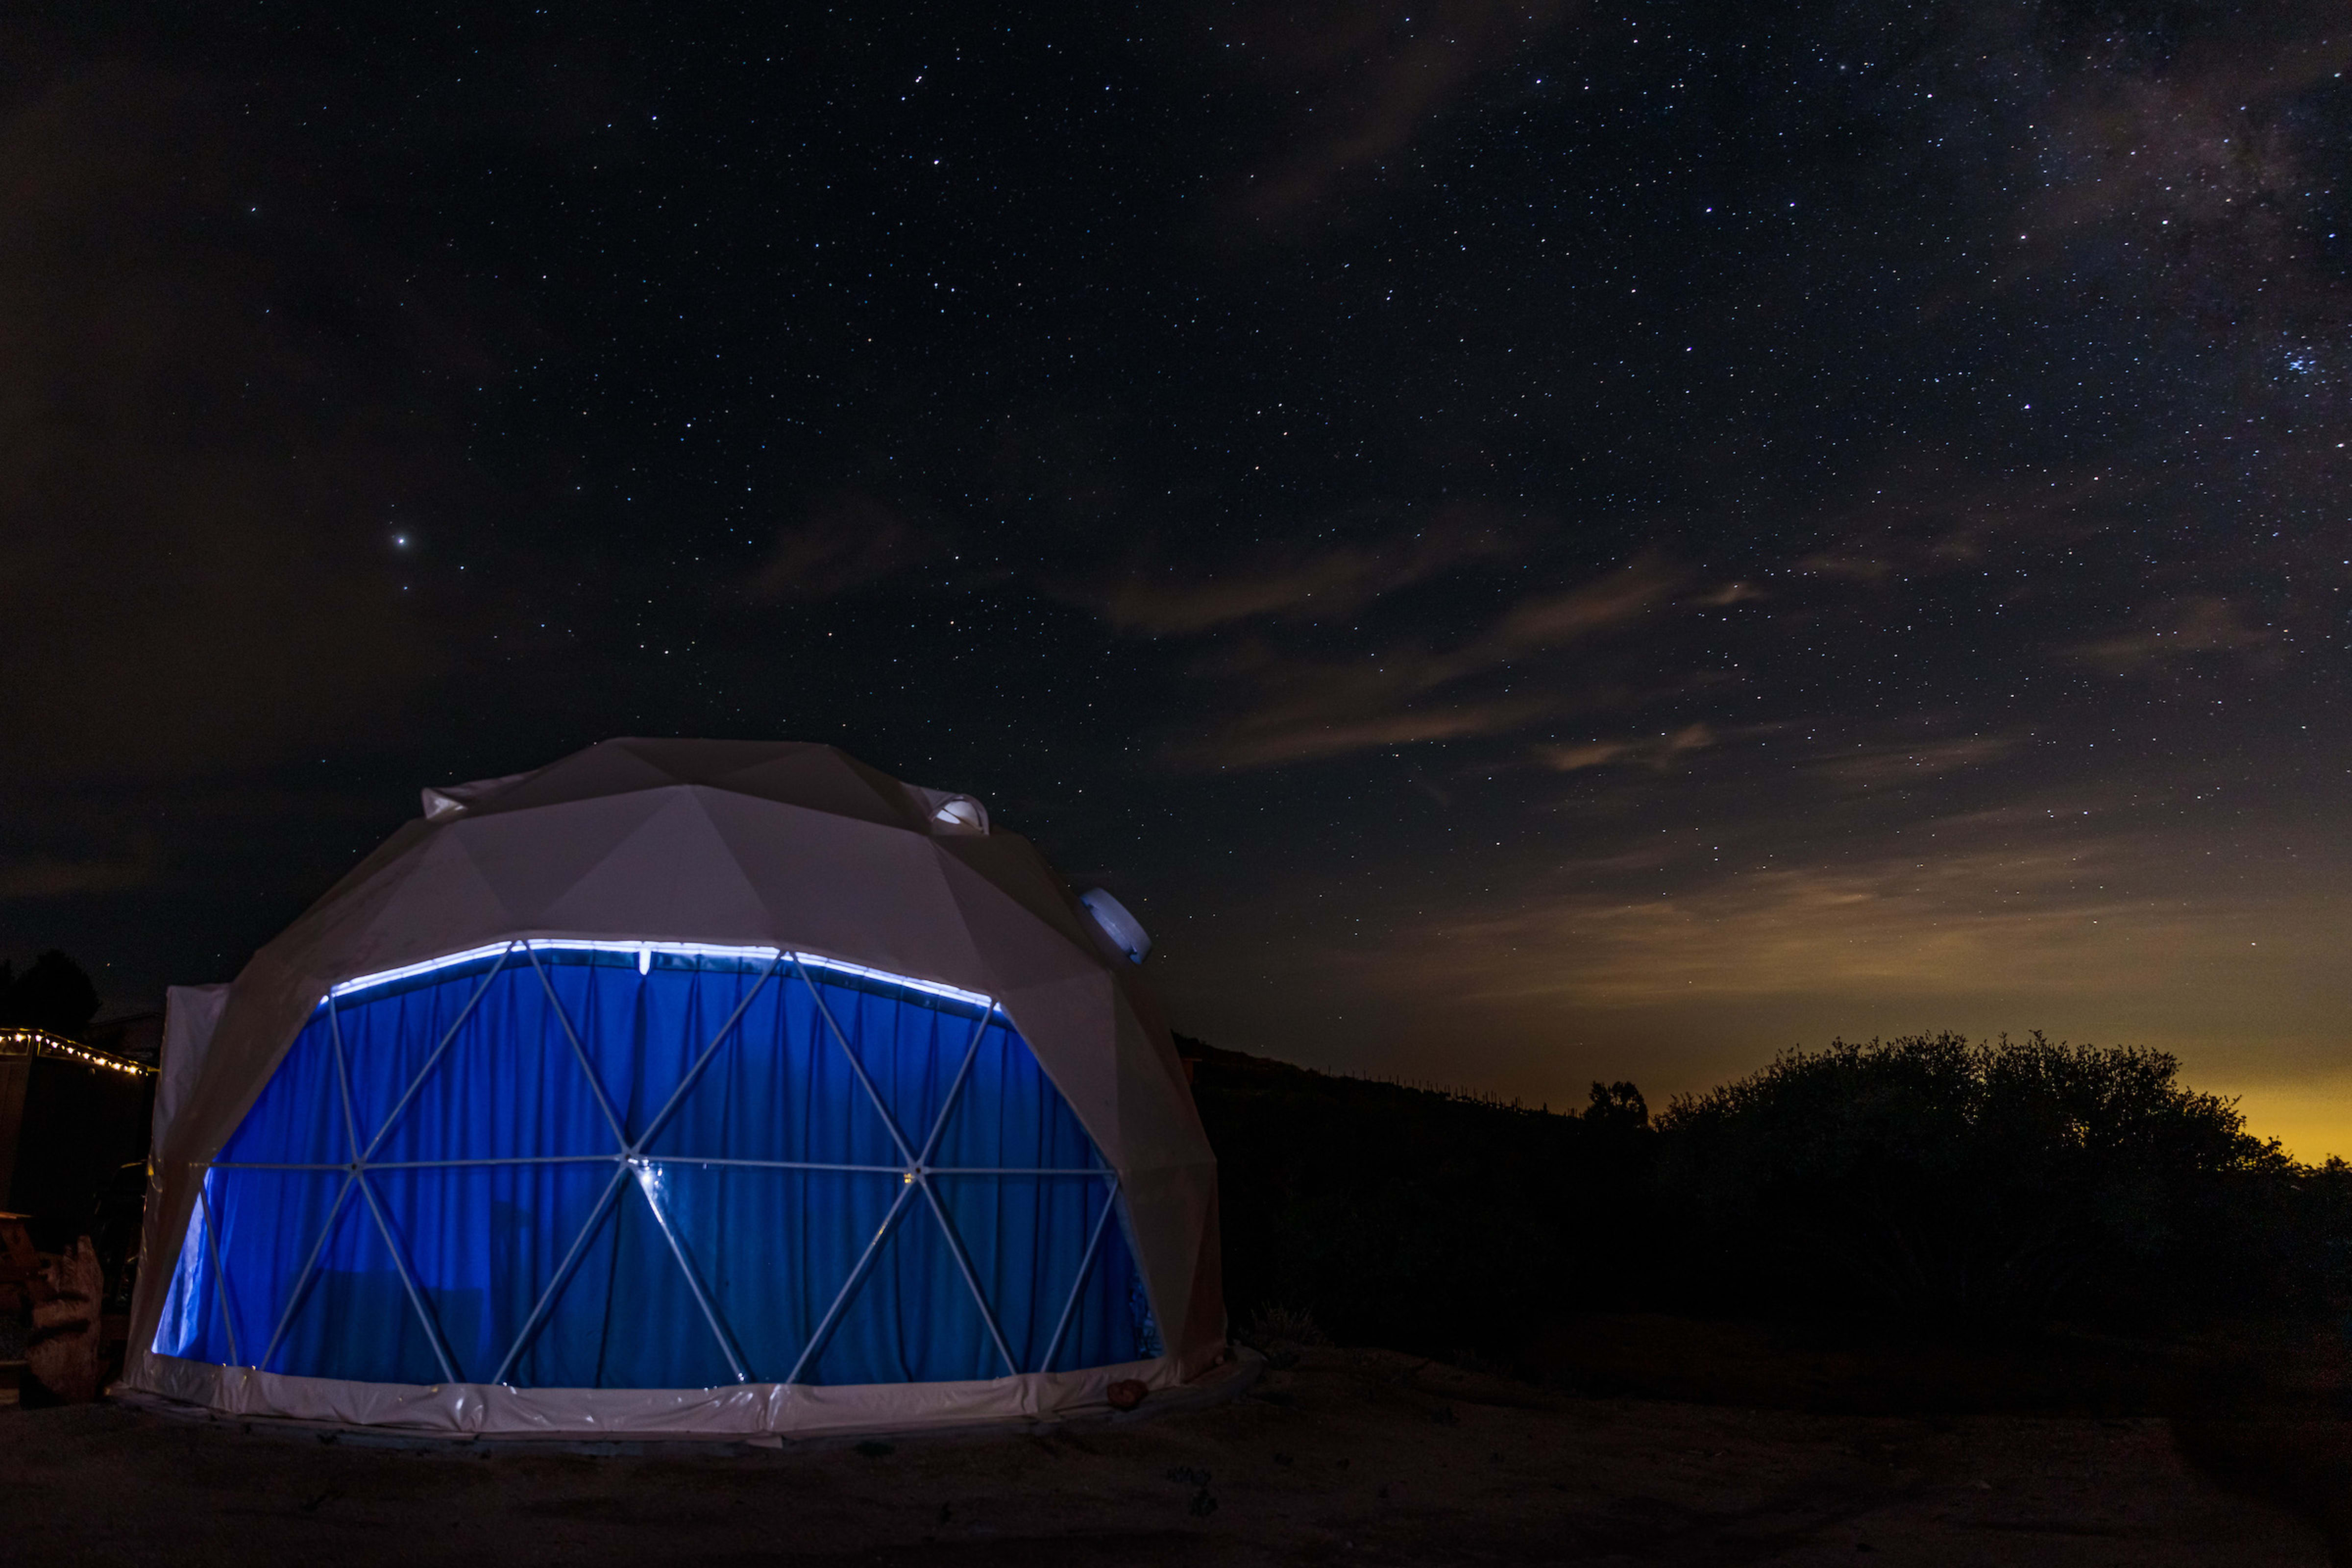
Sun & Moon Retreat in Dewey, Arizona (Photo by Hipcamp Photographer Walter Rachel)
This post was written by Hipcamp Staff Product Manager Mike Kolarik, Hipcamp Staff Software Engineer Evgeny Karataev, and Promoted.ai Co-Founder & CEO Andrew Yates.
In 2021, Hipcamp launched personalized search ranking in partnership with Promoted.ai to better match campers with the perfect Hipcamp. Since then, our engineering teams have continued to work together to add new machine learning (ML) features to drive conversion rate improvements.
Most of the time, the impact of these features is unsurprising, if not predictable. For example, it’s no wonder that the price of a Hipcamp influences how likely a camper is to click on a search result. We also weren’t shocked to see that upcoming availability influences how likely a camper is to book. But, every now and then the data surprises us…
Let’s take a look at how we discovered that we could use the sun and the moon to predict conversion.
Collecting weather and calendar data
Our journey starts with a hypothesis: Understanding a location’s weather should allow us to better recommend Hipcamps. If it is extremely hot, maybe campers are more interested in campsites with access to water, for example. So, we use Apple’s WeatherKit API to collect historical and forecast data for each of our Hipcamps using a daily Airflow job. With this, we’re able to collect all of the following weather factors:
General weather
- Condition code
- Maximum temperature
- Minimum temperature
- Maximum UV index
Precipitation and snowfall
- precipitation_amount
- precipitation_chance
- precipitation_type
- snowfall_amount
Solar and lunar calendar
- Astronomical sunrise
- Civil sunrise
- Nautical sunrise
- Astronomical sunset
- Civil sunset
- Nautical sunset
- Solar midnight
- Solar noon
- Moon phase
- Moonrise
- Moonset
Transforming the data
Now that we had the raw data, we needed to get it in better shape before integrating it into our ML data pipelines. While sending a 10-day forecast for every Hipcamp is reasonable, it wasn’t reasonable to send daily historical weather data for every Hipcamp. So, we use dbt to transform historical data into weekly aggregates, with the assumption that weekly data would be more meaningful and efficient for our pipeline. Here’s where we landed:
Weather history: 52-week aggregate
- Average precipitation
- Average chance of precipitation
- Average snowfall
- Maximum temperature
- Minimum temperature
- Week number of the year
Adding new machine learning features
With the data in good shape, it was time to add the new features to our ML pipeline. We decided to create features relative to the current date with the assumption that historical weather data is more useful in this context. Here’s what we added, representative of the code used.
Forecast features
- weather_temperature_[min/max]_celsius_#_days_from_now
- weather_moon_phase_#_days_from_now
- weather_moonrise_#_days_from_now
- weather_moonset_#_days_from_now
- weather_sunrise_civil_#_days_from_now
- weather_sunset_civil_#_days_from_now
- weather_condition_code_#_days_from_now
- weather_precipitation_type_#_days_from_now
- weather_max_uv_index_#_days_from_now
- weather_precipitation_amount_#_days_from_now
- weather_snowfall_amount_#_days_from_now
Historical features
- weather_historical_[min/max]_temperature_celsius_#_weeks_from_now
- weather_historical_avg_precipitation_amount_#_weeks_from_now
- weather_historical_avg_precipitation_chance_#_weeks_from_now
- weather_historical_avg_snowfall_amount_#_weeks_from_now
At this point, we made the decision to include some of the more obscure weather features such as sunrise and moonset. After all, it couldn’t hurt—and doing so required no extra effort. Our daily pipeline updates all features and sends them to Promoted.ai via the Item Content Management System (CMS) as JSON in a batch. The JSON documents are converted into numeric, sparse, or categorical features for use in ML models for search ranking. Each day, new models are automatically trained with any new features. If the new model is better at predicting clicks and bookings, it is immediately launched into production.
So, what happened?
Inspecting the results
To understand the impact of individual weather features in our models, Promoted.ai worked with us to create Feature Importance Reports. The daily reports showed that while straightforward features like “distance” and “historical click-through rate” remain the most impactful, our new features are indeed useful for prediction!
Who would have guessed that the time the moon sets in 5 days could be used to predict how likely someone is to click on a Hipcamp search result?

Interpreting the results
If you are like us, at this point you may have a healthy sense of skepticism. At Hipcamp, we pride ourselves on being data-driven, but we can’t ignore the impulse to tell a story with the numbers. So, ignoring the perils of interpreting black-box models, we offer the following potentially controversial explanation—going outside is influenced by what’s going on outside.
It’s not a stretch to assume that camping is influenced by the weather. You won’t find a lot of campers in a tent during a snowstorm. Similarly, it’s reasonable to assume that camping is primarily a seasonal activity. We consistently see that things like the appearance of wildflowers in spring and the turning of the leaves in fall impact our business.
So, it shouldn’t be surprising that feeding our models more “outside” features would yield results. After all, there is no single feature that could encapsulate what’s happening outside. Spring in England is different from spring in Arizona, just as June in New South Wales is very different from June in Nova Scotia.


What’s next?
Now that we have the data and we’ve proven its usefulness, it’s time to bring it front and center for Hipcampers in the form of new UX experiences. Our mission to get more people outside depends on our ability to bring the outside into our product. Here are some examples for you:
Stay tuned for an upcoming blog following one product manager on their journey to create a weather widget with the help of a Large Language Model…
Recent Posts
The Best Places to See Blooming Bluebells in the UK
As springtime hits the UK, the winter blues are replaced with a violet hue of a different kind. A carpet…
Morel Mushroom Hunting Season: The 2024 Camping Guide
Spring is springing. And we all know what that means—the 2024 morel mushroom season is underway. To increase your chances…
Hipcamp Awards 2024: Best RV & Van Spots in the US
To help you find the best camping in the country, each year we compile data from bookings, reviews, and ratings…
Hipcamp Awards 2024: Best RV & Van Spots in Canada
To help you find the best camping in the country, each year we compile data from bookings, reviews, and ratings…
Hipcamp Awards 2024: Best Caravan Spots in Australia
Awards season has arrived! To help you find the best camping in the country, each year we compile data from…
Hipcamp Awards 2024: Best Campervan Spots in the UK
To help you find the best camping in the country, each year we compile data from bookings, reviews, and ratings…